Wednesday, June 24, 2015

Gartner’s Magic Quadrant for Structured Data Archiving and Application Retirement 2015

Magic Quadrant's definition: Structured data archiving is the ability to index, migrate and protect application data in secondary databases or flat files typically located on lower-cost storage for policy-based retention. It makes data available in context and protects it in the event of litigation or an audit.

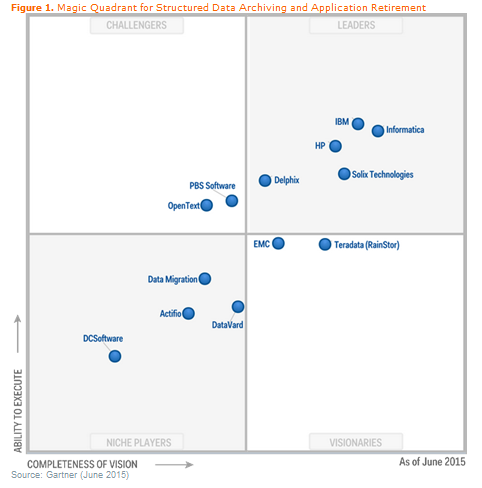
IBM, Informatica, Delphix, Solix Technologies & HP are in the leader's quadrant of "Gartner’s Magic Quadrant for Structured Data Archiving and Application Retirement 2015 " considering following criteria by Gartner

·         Storage optimization — It can reduce the volume of data in production and maintain seamless data access. The benefits of using this technology include reduced capital and operating expenditures, improved information governance, improved recoverability, lower risk of regulatory compliance violations, and access to secondary data for reporting and analysis.
·         Governance — The technology preserves data for compliance when retiring applications. Structured data is often transactional and related to financial accounts or back-office functions (for example, HR, patient enrollment in healthcare and other use cases that might be regulated) that require information governance, control and security, along with the ability to respond to related events such as audits, litigation and investigation. These and other requirements, such as maintaining information context, can prevent organizations from moving data to lower-cost tiers of storage, or adopting other do-it-yourself approaches.
·         Cost optimization — Structured data archiving and application retirement can result in significant ROI. Structured data in legacy systems, ERP and databases accumulates over years — and, in some cases, over decades — driving up operational and capital expenses.

·         Data scalability — The technology can manage large volumes of nontraditional data resulting from newer applications that can generate billions of small objects. Scalability to petabytes of capacity is required in these cases.

Source : Gartner 

Tuesday, April 21, 2015

Magic Quadrant for Multichannel Campaign Management : 2015

The multichannel campaign management (MCCM) market comprises vendors that seek to orchestrate company communications and marketing offers to customer segments across channels, such as websites, mobile, social, direct mail, call centers and email. Capabilities include:

  • Basic campaign management includes functions for segmentation, campaign creation, campaign workflow and campaign execution.
  • Advanced analytic functions include predictive analytics and campaign optimization.
  • Advanced execution functions include loyalty management, content management, event triggering, and real-time offer management in inbound and outbound environments.
  • Digital marketing capabilities include ad management, content marketing, mobile and social marketing, Web, and email marketing. Digital marketing extends the marketing process through channels such as the Web, email, video, mobile and social applications, point-of-sale terminals, interactive TV, and digital signage and kiosks.
  • MCCM offerings may also integrate marketing offers and leads with sales for execution in B2B and business-to-consumer (B2C) companies.


IBM, SAS, Teradata, Oracle, Adobe & Salesforce are in the leader's quadrant of "Magic Quadrant for Multichannel Campaign Management : 2015" report.


Note: Source Gartner

Thursday, April 2, 2015

The Forrester Wave™: Big Data Predictive Analytics Solutions, Q2 2015

Predictive analytics uses algorithms to find patterns in data that might predict similar outcomes in the future. A common example of predictive analytics is to find a model that will predict which customers are likely to churn. For example, telecommunications firms can use customer data such as calls made, minutes used, number of texts sent, average bill amount, and hundreds of other variables to find models that will predict which customers are likely to change mobile carriers. If a carrier can predict the reasons why customers are likely to churn, it can try to take preemptive action to avoid this undesirable outcome.

This isn’t a one-time operation; firms must rerun their analysis on new data to make sure the models are still effective and to respond to changes in customer desires and competitors. Many firms analyze data weekly or even continuously. Game-changing insights start with asking creative, deep questions. Once the question has coalesced, use these six steps to answer them in a continuously improving predictive discipline


  • Identify data from a variety of sources.
  • Wrangle the data.
  • Build a predictive model.
  • Evaluate the model’s effectiveness and accuracy.
  • Use the model to deliver actionable prescriptions to your business peers.
  • Monitor and improve the effectiveness of the model.


SAS, IBM, SAP lead The Pack in ‘The Forrester Wave™: Big Data Predictive Analytics Solutions, Q2 2015’.


Tuesday, March 17, 2015

The Forrester Wave™ Enterprise Data Virtualization, Q1 2015

The data virtualization market is growing as enterprise architects adopt the technology to support requirements for secure, self-service access to real-time data. These solutions provide a virtualized data services layer that integrates data from heterogeneous data sources and content in real-time, near-real time, or batch as needed to support a wide range of applications and processes. Data provided through the data services layer can be updated, transformed, and/or cleansed when (or before) applications access it. Data virtualization can do more than just basic federation; it can do transactions that write back to the original data source.

Informatica, IBM, SAP, Oracle, Denodo Technologies, Cisco Systems are the leaders in The Forrester Wave™-Enterprise Data Virtualization, Q1 2015


For more please refer: https://www.informatica.com/forrester-enterprise-data-virtualization.html 

Wednesday, February 25, 2015

Gartner Magic Quadrant for Business Intelligence and Analytics Platforms : 2015

The BI and analytics platform market is undergoing a fundamental shift. During the past ten years, BI platform investments have largely been in IT-led consolidation and standardization projects for large-scale systems-of-record reporting. These have tended to be highly governed and centralized, where IT-authored production reports were pushed out to inform a broad array of information consumers and analysts. Now, a wider range of business users are demanding access to interactive styles of analysis and insights from advanced analytics, without requiring them to have IT or data science skills. As demand from business users for pervasive access to data discovery capabilities grows, IT wants to deliver on this requirement without sacrificing governance.


Tableau, Information Builders (WebFOCUS BI), MicroStrategy, QlikView , Oracle, IBM, SAP, MicroSoft & SAS are in the leader's quadrant for "Magic Quadrant for Business Intelligence and Analytics Platforms : 2015".


As a result of the market dynamics discussed above, for this Magic Quadrant, Gartner defines BI and analytics as a software platform that delivers 13 critical capabilities across three categories — enable, produce and consume — in support of four use cases for BI and analytics.
·         Enable
o   Business User Data Mashup and Modeling
o   Internal Platform Integration
o   BI Platform Administration
o   Metadata Management
o   Cloud Deployment
o   Development and Integration
·         Produce
o   Free-Form Interactive Exploration
o   Analytic Dashboards and Content
o   IT-Developed Reporting and Dashboards
o   Traditional Styles of Analysis
·         Consume
o   Mobile
o   Collaboration and Social Integration

o   Embedded BI

 Note: Content is from Gartner . Refer: http://www.tableau.com/gartner-magic-quadrant-2015 

Sunday, February 22, 2015

Gartner Magic Quadrant for Advanced Analytics Platforms: 2015

Gartner defines advanced analytics as the analysis of all kinds of data using sophisticated quantitative methods (for example, statistics, descriptive and predictive data mining, simulation and optimization) to produce insights that traditional approaches to business intelligence (BI) — such as query and reporting — are unlikely to discover.

An advanced analytics platform provides a full suite of tools for use by knowledgeable users, traditionally data scientists. However, they are increasingly being directed at business analysts and "citizen data scientists," to enable them to perform a variety of analyses on different types of data. In today's market, much analysis is predictive in nature, although descriptive analysis is often needed as well, especially for data exploration. While these analytical capabilities remain important, additional analytic techniques such as forecasting, optimization and simulation will grow in importance.

SAS, IBM (SPSS), Knime & RapidMiner are in the leaders quadrant for "Magic Quadrant for Advanced Analytics Platforms: 2015".


Gartner Evaluated considering following Criteria:

  • Product or Service: A use-case-weighted average of the scores in the accompanying "Critical Capabilities for Advanced Analytic Platforms"
  • Customer Experience: A combination of feedback from users about their overall satisfaction with the company and its product, and the product's integration.
  • Overall Viability: An evaluation of the viability of best-of-breed vendors and the importance of this product line to larger vendors.
  • Market Responsiveness and Track Record: An evaluation based on the size of the active customer base and new sales traction since last year.
  • Marketing Execution: An evaluation based on how well the product has achieved market awareness and the market's understanding of its value proposition.


Note: Content from Gartner

Tuesday, February 17, 2015

Magic Quadrant for Data Warehouse and Data Management Solutions for Analytics 2015

Magic Quadrant's definition: a data management solution for analytics is a complete software system that supports and manages data in one or many disparate file management systems (most commonly a database or multiple databases) that can perform relational processing (even if the data is not stored in a relational structure) and support access and data availability from independent analytic tools and interfaces.

Teradata (TD, AsterData, UDA suite), IBM (PureData.. Netezza), Oracle (Exadata ..Oracle Big Data Appliance), SAP (IQ & Hana), Microsoft (SQL Server Parallel Data Warehouse and HDInsight) & HP (Vertica, Autonomy) are in the leader's quadrant of "Magic Quadrant for Data Warehouse and Data Management Solutions for Analytics 2015" considering following criteria by Gartner:


  • Relational data management.
  • Non-relational data management.
  • No specific rating advantage is given regarding the type of data store used (for example, RDBMS, HDFS, key-value, document; row, column and so on).
  • Multiple solutions in combination to form a DMSA are considered valid (although one approach is adequate for inclusion), but each solution must demonstrate maturity and customer adoption.
  • Cloud solutions (such as PaaS) are considered viable alternatives to on-premises warehouses; and ability to manage hybrids between premises and the cloud are considered advantageous.
  • DMSAs are expected to coordinate data virtualization strategies for accessing data outside of the DBMS, as well as distributed file and/or processing approaches.